Health
Kiali help users know whether their service mesh is healthy. This includes the health of the mesh infrastructure itself, and the deployed application services.
Service Mesh Infrastructure Health
Users can quickly confirm the health of their infrastructure by looking at the Kiali Masthead. If Kiali detects any health issues with the infrastructure of the mesh it will show an indication in the masthead, severity will be reflected via color, and hovring will show the detail:

For more detail on how Kiali tracks the Istio infrastructure status, see the Istio Status Feature.
Overview Health
The default Kiali page is an Overview Dashboard. This view will quickly allow you to identify namespaces with issues. It provides a summary of configuration health, component health and request traffic health. The component health is selectable via a dropdown and the page offers various filter, sort and presentation options:

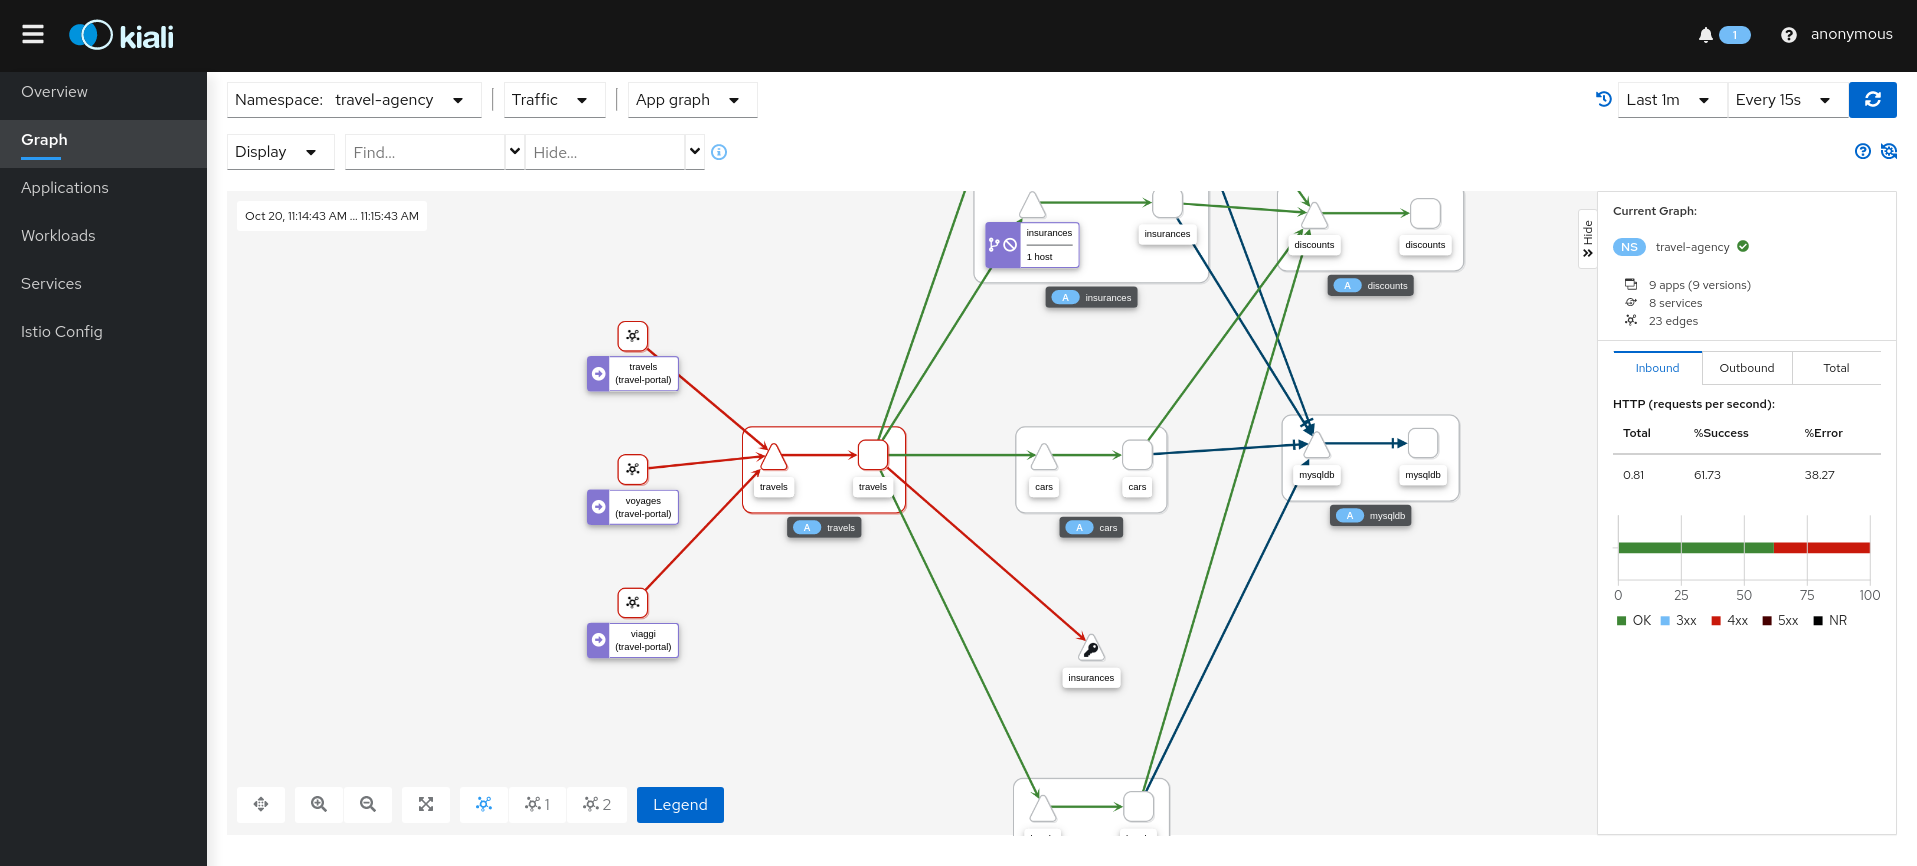
Graph Health
The Kiali Graph offers a rich visualization of your service mesh traffic. The health of Nodes and Edges is represented via a standard color system using shades of orange and red to reflect degraded and failure-level traffic health. Red or orange nodes or edges may need attention. The color of an edge represents the request health between the relevant nodes. Note that node shape indicates the type of component, such as service, workload, or app.
The health of nodes and edges is refreshed automatically based on the user’s preference. The graph can also be paused to examine a particular state, or replayed to re-examine a particular time period.

Health Configuration
Kiali calculates health by combining the individual health of several indicators, such as pods and request traffic. The global health of a resource reflects the most severe health of its indicators.
Health Indicators
The table below lists the current health indicators and whether the indicator supports custom configuration for its health calculation.
| Indicator | Supports Configuration |
|---|---|
| Pod Status | No |
| Traffic Health | Yes |
Icons and colors
Kiali uses icons and colors to indicate the health of resources and associated request traffic.
-
 No Health Information (NA)
-
 Healthy
-
 Degraded
-
 Failure
Custom Request Health
There are times when Kiali’s default thresholds for traffic health do not work well for a particular situation. For example, at times 404 response codes are expected. Kiali has the ability to set powerful, fine-grained overrides for health configuration. For details, see Traffic Health Configuration.